Analysis of TECHNICON IGBTs thermal modes using a specialized simulation tool
Andrew Chen, info@technicon.asia
Analysis of the temperature modes of power modules is one of the most important stages of development, which makes it possible to confirm the correctness of choice of electronic parts, which largely determines the reliability of system. The current and voltage limits specified in module name and header of datasheets are determined by IGBT chips, and do not provide designer with any useful data for calculation. At the same time, it is important to maximize the use of power device characteristics in order not to pay extra money for an unjustified power reserve.
Development engineers are well aware of simulation tools produced by the biggest manufacturers of power semiconductors (Semisel/SEMIKRON, Iposim/Infineon, Melcosim/Mitsubishi). These tools are designed to calculate power losses and junction temperatures of power semiconductor devices based on working modes for various inverter configurations. However, their databases contain only modules manufactured by the relevant companies, which is logical from a marketing point of view.
But what should we do if we want to evaluate the temperature modes of inverter based on another IGBTs, f.e. TECHNICON [1] and compare them with other similar devices? This opportunity is provided by specialized software that has the option of creating a thermal model based on datasheets. This article will be useful for both beginners and experienced specialists involved in the development of power converters.
General considerations
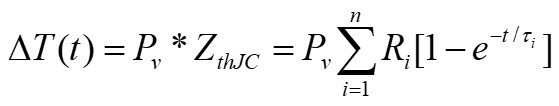
The main way to determine junction temperature of power device in switch mode is to use ZthJC - dynamic thermal impedance curve. The initial data are power dissipation Pv in one conduction pulse ti, pulse duration and duty cycle (DC). To computerize the calculation, dynamic thermal impedance curve is expressed as an analytical function and temperature gradient DT is determined by formula:
Number of publications, for example [3, 4] consider main modes of operation of power stages and expressions for power losses and temperature gradients calculating are given in relation to the following situations:
- single short pulse (temperature does not reach steady state);
- sequence of defined number of single rectangular pulses, this mode is used to approximate arbitrary-shaped signals;
- PWM signal with fixed DC;
- periodic sequence of pairs of different pulses.
Actual operating conditions of power stages can be considered as various combinations of these modes.
The main issue of thermal calculation, including automated calculation, is the determination of the power dissipation over a working cycle. It is defined as the sum of static losses (conduction losses) depending on current and direct voltage drop, dynamic losses proportional to the energy Esw and operating frequency Fsw. Calculating of power losses is a complex multi-step process that requires many iterations. All components of formulas depend on each other, operating temperature, circuit configuration, as well as many other factors. Therefore, to automate the thermal calculation, it is necessary to create expressions that take into account all the dependencies of parameters affecting heating.
Next, we will talk about the methods, formulas and approximations used by thermal simulation tools. Knowledge of these factors is necessary both for the correct application of the software and for a better understanding of processes occurring in power modules and stages.
Losses and principles of operation of thermal simulation software
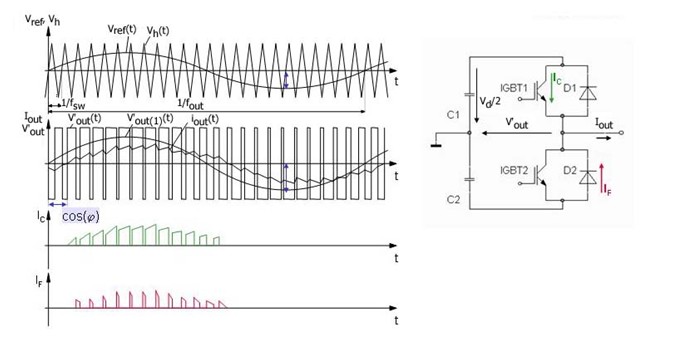
Fig. 1. Electrical circuit of half-bridge, typical voltage and current curves
One of the most difficult and interesting tasks of power electronics is to determine the power dissipation of half-bridge stage operating in sinusoidal PWM mode, used in frequency converters, power drives, etc. The simplest and most understandable principle of generation of PWM signal is to compare (for example, using a comparator) sinusoidal signal of main frequency Vref(t) and triangular carrier signal Vh(t). In this case, a pulse signal V'out(t) will be observed at the comparator output with duty cycle proportional to the instantaneous value of input sinusoidal voltage, and amplitude is equal to supply voltage Vd (Fig. 1). The figure shows a plot of current Iout(t) in an active-inductive load, f.e. asynchronous motor.
Load current is close to sinusoidal, current ripples depend on PWM pulse duration Tp, load inductance L, and supply voltage Vd and can be determined from expression: di/Tp = Vd/L. Amplitude of output voltage V'outm(1) and load current depends on the modulation factor M = Voutm(1)/Vd, which is set by maximum value of duty cycle.
Figure 1 also shows collector current of one of half-bridge IGBT leg IC and current of opposite diode IF. The phase shift between the current and voltage due to the inductive nature of the load determines power factor or cos(j).
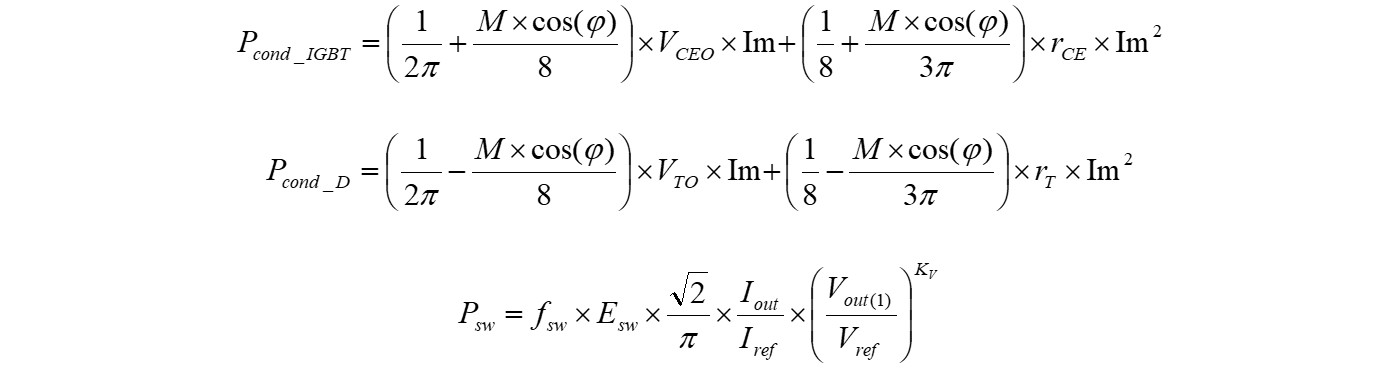
The most common power stage is a 3-phase inverter consisting of three half bridges. Formulas for calculating the static and dynamic losses of IGBTs and antiparallel diodes (FWD) in this case are rather complex:
If you are engaged in thermal calculations, you can assess how much designers need a tool that allows them to automate this difficult work. The main purpose of thermal simulations is to determine junction temperature Tj, which is an «integral» indicator that confirms the correct choice of a power device and its operating modes. However, the issue also lies in the fact that many semiconductor parameters depend on Tj. In order to take these dependencies into account, the following expressions are used in a specialized thermal calculation software:
VTO = VTO_25°C ´ (1 + TC ´ (Tj – 25°C))
rT = rT_25°C ´ (1 + TC ´ (Tj – 25°C))
Esw = Esw_25°C ´ (1 + TC ´ (Tj – 25°C))
Where VTO_25°C, rT_25°C, Esw_25°C – are datasheet values of cut-off voltage, dynamic resistance and switching energy, ТС – corresponding temperature coefficient. Figure 2 shows a graphical method for determining TC for VTO and rT. TC value for Esw is determined in similar way from the curve Esw = f(IC).
In order to obtain the most accurate value of die temperature, taking into account the thermal dependence of parameters, several iterations are used (Fig. 3): after calculating heatsink temperature Ts and chip temperature Tj, a new power loss analysis is performed and then, based on the newly obtained values, the final value of Tj is calculated.
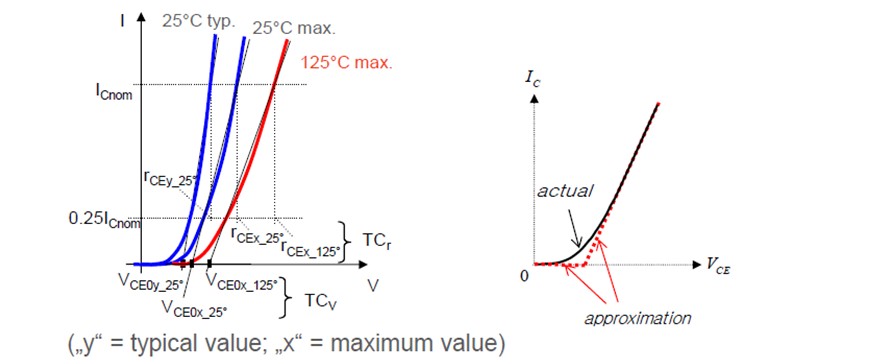
Fig. 2. Determination of temperature coefficients and approximation parameters from output characteristic of semiconductor device
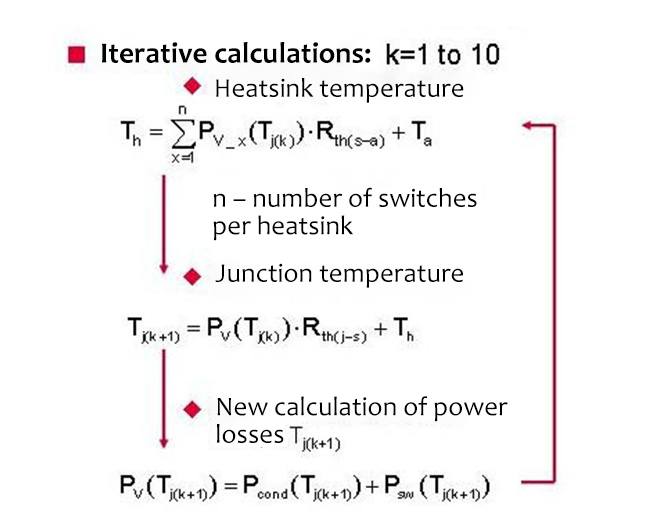
Fig. 3. Iterative calculation of loss power PV and junction temperature Tj
Dynamic thermal simulation, which takes into account heat capacity of die and all other elements of module, is performed using an equivalent electrical circuit known as a «Foster chain». It contains a sequence of RC pairs (usually 4 or 5) that simulate the thermal resistance and thermal capacitance of structural layers of power device, which allows a fairly accurate display of the dynamic thermal impedance curve Zth.
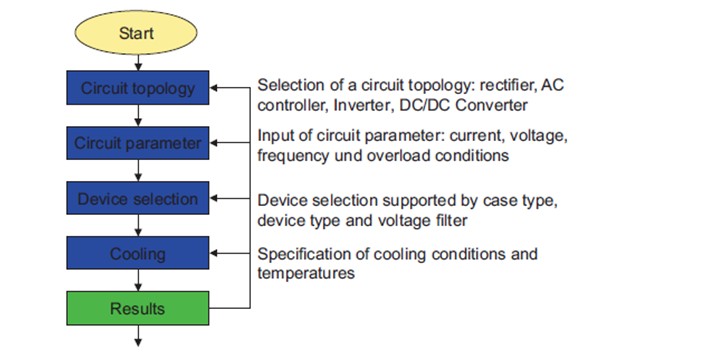
Рис. 4. Program steps in “step by step” dimensioning
When analyzing any circuit, user performs a standard set of operations shown in Figure 4. After choosing circuit configuration and entering the input data, it is necessary to select the type of device from the proposed set of modules capable of solving the task, as well as set cooling mode and cooling parameters. Next, losses and overheating temperature of all module elements are automatically calculated. Based on the results obtained, user can return to any step of the calculation and make appropriate adjustments.
The most interesting is thermal simulation of widely used 3-phase inverter B6I, Figure 5 shows the circuit and menu for setting the initial data.
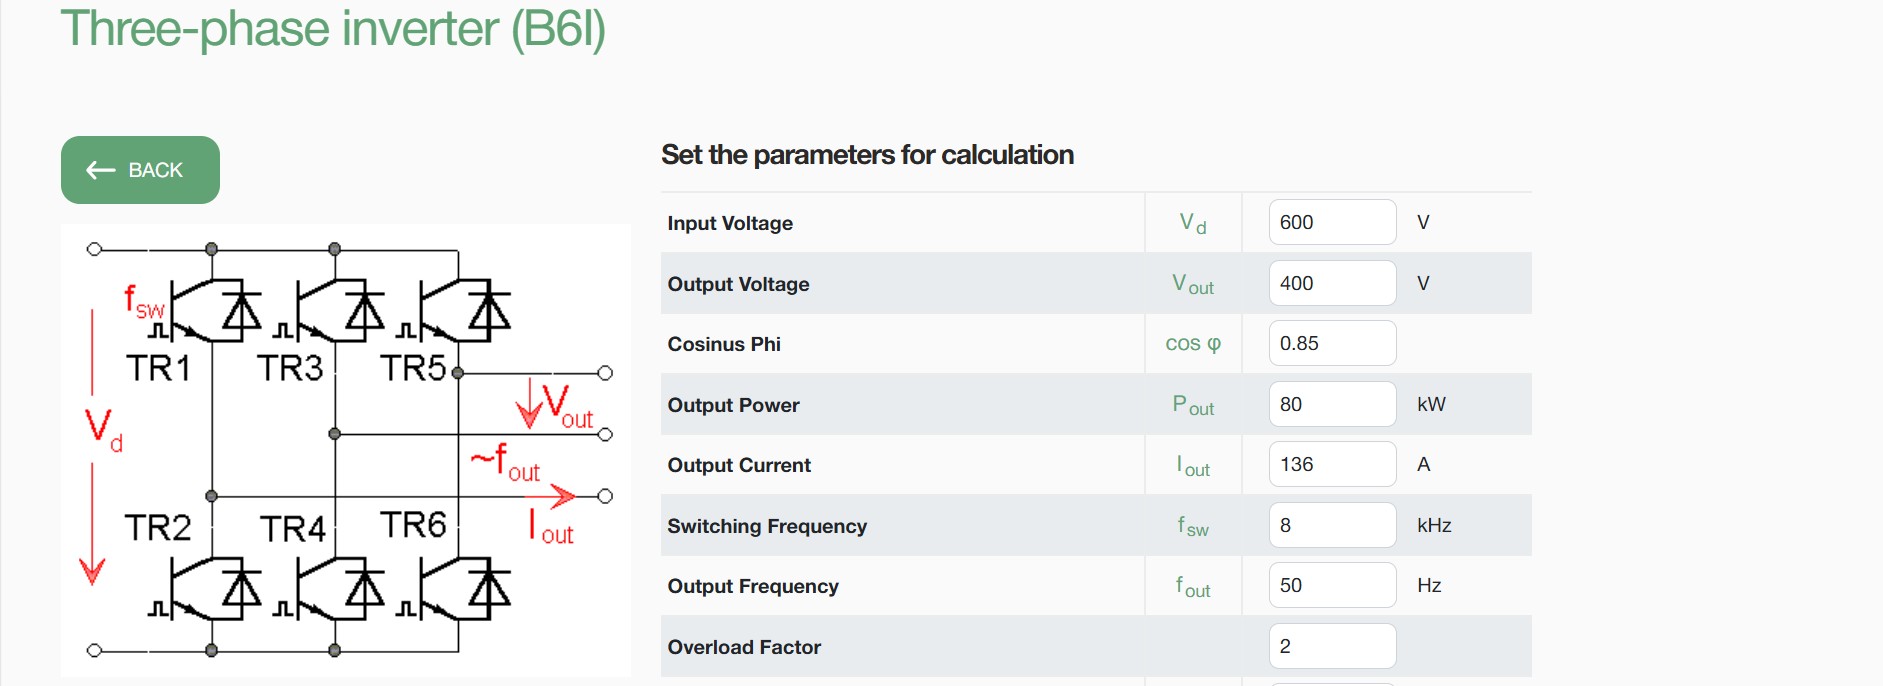
Fig. 5. Electrical circuit and menu with input data for 3-phase inverter B6I
An important feature of the specialized software is possibility of simulation of inverter with parallel IGBTs - this configuration is often used to increase power of converter system. Simulation tool allows setting the number of «virtual» switches on one heatsink and number of IGBTs connected in parallel per phase.
User has to select cooling method (natural, forced air, liquid), specify type of heatsink, temperature and volume of cooling air or cooling water. Database includes parameters of some standard heatsink profiles, user can also determines customized heatsink parameters using elements of «Foster chain» (Tau, Rth). It is also possible to make the simulation at a fixed Ts temperature – this option is useful, for example, for calculating low-power converters mounted on a massive chassis.
Creation of thermal models IGBT TECHNICON
However, let's return to the main topic of the article – creation of IGBT thermal models that are not included in the database. The development of such models and comparison of thermal characteristics of different IGBTs is a complex task that requires a deep understanding of ways to rate module parameters specified in datasheets and physical meaning of processes occurring in power devices.
For example, in datasheets of absolutely identical modules from different producers, different values of thermal resistances «junction-case» Rth(j-c) and «case-heatsink» Rth(c-s) may be indicated. This is due to the fact that manufacturers use different ways of rationing these important characteristics. The thoughtless use of random Rth values for comparison leads to obviously erroneous results.
Table 1. Parameters for creation of customized thermal model
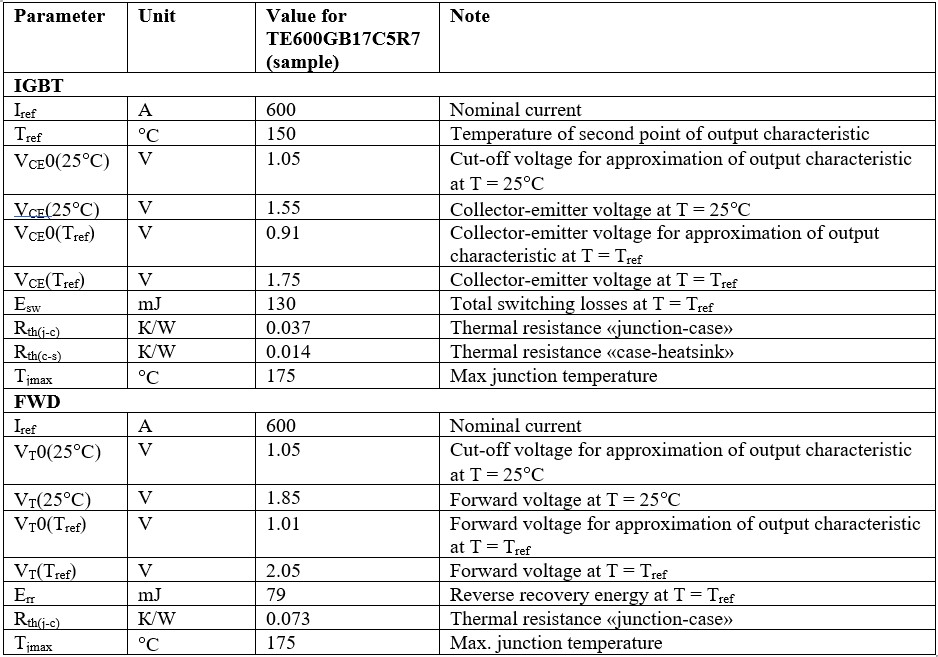
Table 1 shows main parameters required to create a custom thermal model of IGBT module, in this case - TE600GB17C5R7, manufactured by Technicon [1]. The table contains a lot of parameters, some of them are taken from the datasheet. However, most of the data has to be calculated «manually» based on curves, in particular the output characteristics, as shown in Figure 2. This is a very complex and responsible process that requires a deep understanding of characteristics of power devices.
.jpg)
Fig. 6. Choice of inverter configuration on website www.technicon.asia
Inaccuracies in thermal models directly affect the reliability of calculations, therefore this important process should be entrusted exclusively to experienced technical specialist. This feature is provided to Technicon users on website www.technicon.asia (Fig. 6). Customer can select inverter configuration and set initial data. Next, the data will be sent to Technicon engineers, who select appropriate IGBT module, provide thermal simulation and supply customer with the results.
Summary
Automation of thermal simulation of power converters and component choice has long been an urgent need for designers. Modern thermal simulation tools cover almost all existing schemes and require the user to enter only numerical input data. The main limitation of such tools is the ability to use semiconductor devices from software database only, since all data and factors used in formulas and expressions are calculated for them.
The solution to this problem is use of customized software that allows creation of thermal models based on datasheets. In particular, TECHNICON has created models of all IGBTs available in the production program. These devices are widely used in industrial drives, power supply devices, industrial automation and energy, traction drives of electric vehicles. TECHNICON technicians are always ready to help customers and perform thermal calculations of inverters in various configurations.
References:
- www.technicon.asia.
- Arendt Wintrich. Software release of SemiSel version 3.1.SEMIKRON AN-8004/2008
- Martin Freyberg, Uwe Scheuermann. Measuring Thermal Resistance of Power Modules. PCIM Europe journal, 2003.
- Calculation of the Maximum Virtual Junction Temperature Reached Under Short-time or Intermittent Duty. IEC 60747-6 by SEMIKRON.
Let's connect!

Technical support will respond to you within 48 hours.